May 7, 2021 · Melissa Kavanagh
The 7 Analytics Data Points Hotels Need to Look at Right Now
As of the writing of this post, many destinations in the U.S. are seeing huge shifts in demand from day to day. If you wait until the month ends to review your data, you will be missing out on exactly what consumers are looking for right now. Hoteliers have got to be nimble and able to adjust to the demand of consumers in almost real-time.
Below are our top picks for getting the most actionable insights from your hotel’s analytics data on a daily or weekly basis.
From Booking Engine Custom Data:
You should be tracking some critical data that comes from what website visitors are searching AND what they are booking. If your booking engine doesn’t make this possible, it’s time for a new booking engine. We’ll talk more about best practices for data capture of these items in a bit.
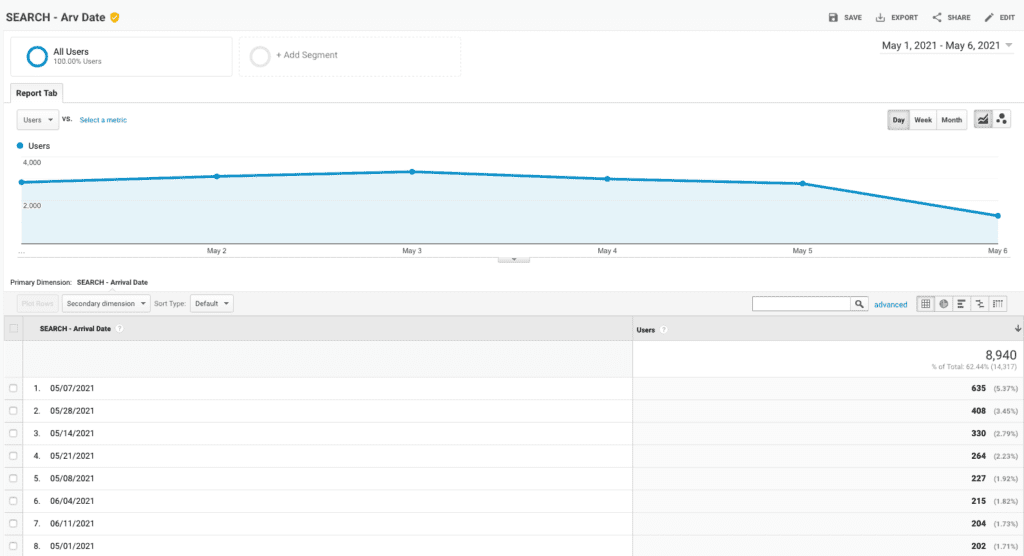
1 – Searched Arrival Date
This is the most granular piece of consumer behavior, but is the most actionable data point in this list. Looking at this information on a daily basis is going to give you the insight into exactly when guests WANT to arrive. This can help you yield your rates and inventory appropriately as demand shifts.
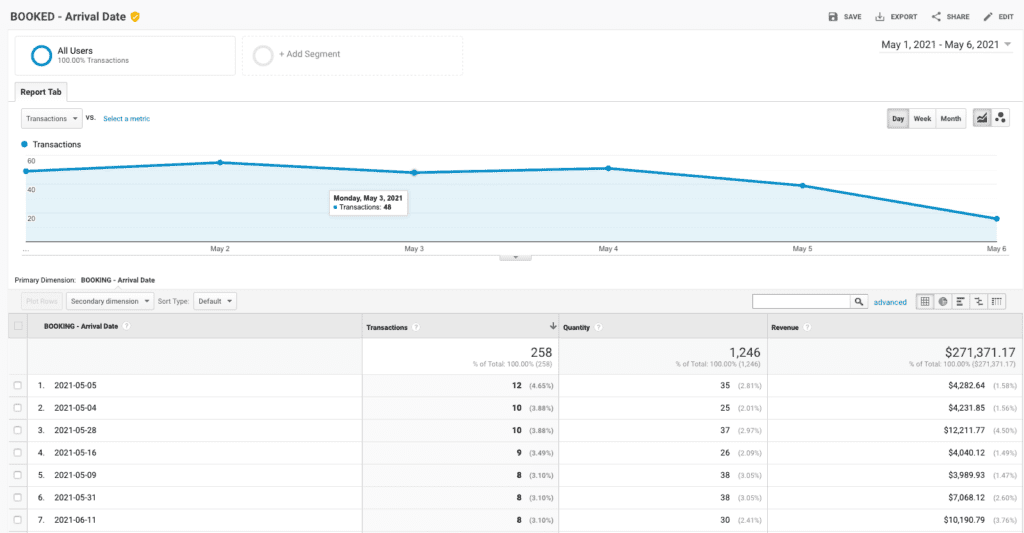
2 – Booked Arrival Date
There isn’t much more straightforward than this…how many people bookings did you get by arrival date. You can couple this information with the search data to get a conversion rate by arrival date. You can also marry it with length of stay (in a custom report in Google Analytics, you would use the “quantity” metric for most booking engines).
Below are examples of Google Analytics custom reports for the search data and booked data for arrival date.
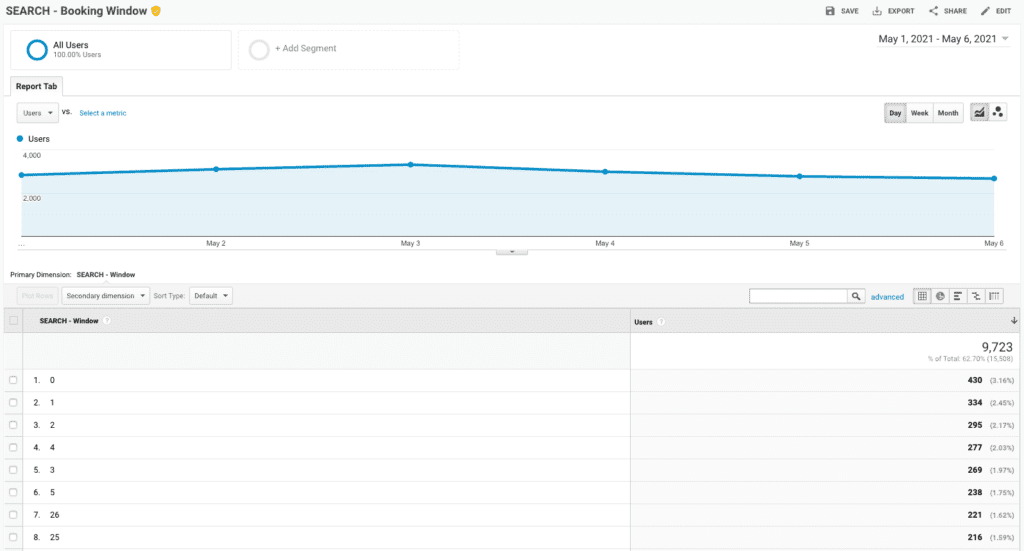
3 – Searched Booking Window
Not as granular as the arrival date, this piece of data is best used trended over time. You can see week by week how the booking window is shifting. Are people starting to search further out or closer in?
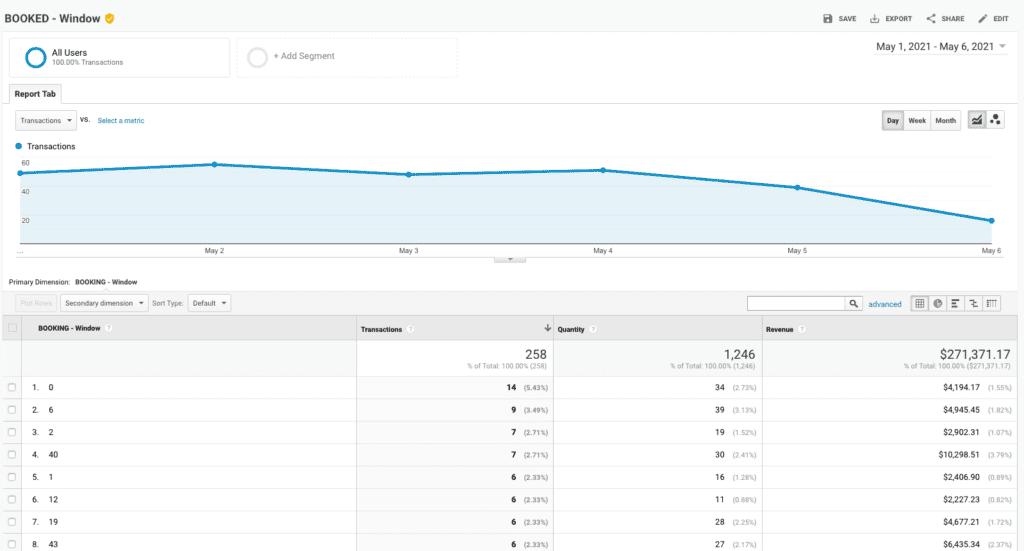
4 – Confirmed Booking Window
As with the search data, the booking window of actual transactions can be trended over time. And again, you can compare the search data against the actual booked data on the window.
These are examples of Google Analytics custom reports for the search data and booked data for booking windows.
5 – Length of Stay
Looking at how long consumers are staying can, again, help you yield your rates, build packages, incentivize mid-week arrivals, etc.
Other Options:
Depending on exactly how you are using this data, and how important it is, you can also look at things like day of arrival or departure (what day of the week), number of adults, number of children, etc.
How to Collect the Custom Data:
In order to collect the custom data on bookings, the best method in Google Analytics is to use custom dimensions. You would use one dimension for each item you want to report on.
CAUTION: The free version of Google Analytics has just 20 custom dimensions available. You should very carefully plan exactly what information is critical to track here.
Once you have your custom dimensions set up, you’ll need to build custom reports in Google Analytics to see the data within the interface. For booking data, you will choose Transactions, Revenue, and possibly Quantity, as your metrics.
Search data collection method can be more your personal preference. This information can either be stored in a Google Analytics event, or in a custom dimension, as we did with the booking data. Depending on how many custom dimensions you used for the booking data (and any other information you are already collecting there), may dictate whether you use events or the dimensions. One advantage of using events is that you don’t need to build a custom report to see the data…it’s already there in the events report. However, in terms of implementation, if you are tracking several different dimensions, you’ll need a separate event tag for each one of them vs. firing one tag with all of your custom dimensions.
From Standard Analytics Data:
Phew! You got through the hard stuff. Here’s some standard data you can find in any analytics system.
6 – Landing Pages
Why are landing pages important to look at regularly? You may find some nuggets of information you weren’t aware of before, or that have changed due to consumer behavior. For example, we have been seeing on a very regular basis in the last few months, that pages like hotel policies, FAQs, or COVID-specific information are seeing more entries from natural search than before…AND they are converting. You’ll want to keep an eye on lower level pages to catch any change in behavior, and make sure your user experience, and content is optimal for those pages that might suddenly be getting attention.
7 – Location by City
Because various feeder markets are in a constant state of flux in terms of quarantine status, it is important to keep an eye on both who is looking at the site, and who is actually booking. This can help you spend your targeted marketing dollars in the most effective way.
Possible Reporting Techniques:
1 – Export the data from Google Analytics to a spreadsheet
This is the most basic way to manipulate your data.
2 – Set up an automated email in Google Analytics
This is one step above simply viewing all of these custom reports and having to export them each time. This allows you to set up a frequency of daily or weekly, and receive all of your reports in your inbox. Keep in mind that the frequency you select for the report also determines what data is in the report. For example, if you select Daily, then the report includes data for the previous day; if you select Weekly, then the report includes data for the previous week.
3 – Build a spreadsheet template, and copy/paste data into it
This technique would be used in conjunction with either option 1 or 2. If you plan on using pivot tables, or formulas, etc., you could set up a template spreadsheet file that you would simply copy and paste the data from your exported GA data into whatever cells would be appropriate in the template. This would eliminate the need to create these formulas every time you want to analyze your data.
4 – Use a data aggregation tool like Supermetrics in a spreadsheet
Using a tool like Supermetrics (not a free tool) can allow you to set up a Google Sheet (or Excel spreadsheet depending on your license) with all of these queries once, and then have the spreadsheet automatically update at whatever frequency you choose. You could also update queries on demand.
5 – Build a report in Google DataStudio
If you are feeling frisky, Google DataStudio is a free data visualization tool, and pulling data in from any Google product has no cost. The beauty of using this tool is that it updates in real time, and you can easily change the date range you would like to analyze on the fly. If you’ve got a little time on your hands, there is definitely a bit of a learning curve, but the time saved using this method vs. methods 1 – 3 can pay off very quickly.
That’s a Wrap
This is not an exhaustive list, by any means, however it should give hoteliers a good starting point to find insight to consumer behavior and make better operational decisions based on that data.
Need help collecting this data, or building these reports? We can help – give us a shout.